Charge Doctor sends out serial data in ascii format at 9600 bauds, one sample every 10 seconds. Softwares used below to record and process data are all free and open source.
N.B. Charge Doctor does not store data. A PC must be connected during the charge to log data in real time.
Ascii format :
Seconds, Voltage (x0.1 V) , Current (x10 mA) , Wh (x0.1 Wh)
90,581,194,25
100,581,194,28
110,582,194,31
example 110,582,194,31 <=> 110s, 58,2V, 1.94A, 3.1Wh
Files :
- Datalogger.exe : capture dongle’s serial data and append to log.txt.
- bin/KST2.exe : chart graphics from log.txt . When log.txt changes, charts are refreshed in real time (KST is an ultra-fast grapher and can display huge data files over hundreds of Mbytes).
- graph.bat : shortcut to launch KST. For English users, run graph_EN.bat
- log*.txt : data files in ascii
Beware : KST requires the default configuration file session.kst. Keep a backup of this file and restore it when needed.
The ascii session file is language dependent : session.kst for French, session_EN.kst for English.
For other languages (Spanish, German…), KST would display nothing because the session file syntax is incorrect so install the English version of KST. However, if you still wish a localized version, just modify parameter name « Colonne » in the configuration file session.kst : open session.kst with a text editor and translate all occurences of « Colonne » into your language and all should be fine.
Installation :
- Create an new folder, eg « c:\program files\kst » (any folder name is fine) and extract the zip file content into that folder (download zip file 13Mb).
- Insert the dongle and install the driver (download driver files 0,22Mb).
Charge Doctor connected to dongle. Don’t remove the yellow strap.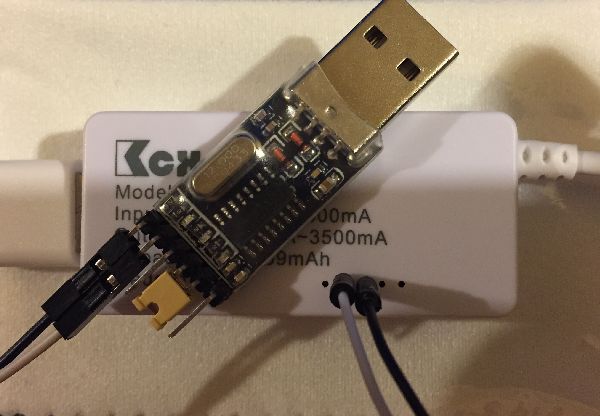
Edit 30/04/2016 : Charge Doctor V2 connected to dongle

Usage :
- Double-click on Datalogger.exe to start logging data to log.txt. First time use : select the dongle’s serial port COMx and set the log file’s name (log.txt) and location (must be in the installation folder). Then click on « Start logging »

- Double-click on graph.bat, ( graph_EN.bat for English users) to run KST, that’s all. When log.txt changes, the charts are refreshed in real time. They must animate with new incoming data. If nothing after 30 seconds, quit KST and restart.
- Before running Datalogger.exe, rename log.txt (eg log_GW14.txt or log_X3Clone.txt) to archive previous logging session
- To plot existing data without logging, copy the archived log file, rename the duplicate to log.txt, and double-click on graph.bat
- Beware, log.txt must be in ascii text format, with separator ‘,’ and no space. Any spurious character (space, tab) will result in reading zeros by KST.exe. If any display problem, check log.txt first with a text editor.
- To create a capture screen in KST, use menu File/Export image
- For more advanced use of KST like adding annotations, dynamic texts, drawings, lines… and even macro programming, see tutorial videos on the internet.
- Use KST’s zoom functions and keyboard shortcut to explore the data plots. The x-axis scroll is somewhat more complicated, follow the steps described below :
Click on the « Change data range » button
Click « Add all » to move all fields from left to right. Change the number of samples and/or options « from start » or « to end ». All other options are let unchanged.
Click « Apply » to update the X-scale change.

Some examples
Firewheel 260Wh. Good Panasonic batteries, I can charge more than 280Wh

Gotway 340Wh. In fact, I can’t charge more than 300Wh. Cheating from GW ?
Generic X3 Clone 130Wh. In fact, I can’t charge more than 125Wh, not bad.

New charging session of the GW14 340Wh, after discharge down to 54.9V (3.43 V/cell) by riding until led flashing then further discharge by connecting to an external resistive load (a hair dryer) down to 52.0V (3.25 V/cell).
Can charge up to 353 Wh so the pack stated capacity 340 Wh is real, no cheating from Gotway. But the mainboard don’t let the discharge go beyond 300 Wh or >90% stated capacity to extend the battery life.

This page has been published in Reference on 16 juillet 2015 .
Great product, and a good post too. I’ll have to do this with my Charge Doctor soon and test all my different wheels.